Content Marketing KPIs for SaaS: The Metrics That Drive Growth
Most SaaS companies track the wrong content marketing KPIs. They obsess over pageviews and social shares while missing the metrics that actually predict revenue. Content marketing for SaaS is fundamentally different from B2C or e-commerce. The buying cycle takes weeks or months, not minutes. Your content needs to educate, build trust, and guide prospects through multiple touchpoints before they sign up for a trial.
This means different KPIs matter. Traffic is table stakes. What matters is whether that traffic converts to trial signups, demo requests, and eventually paying customers. This guide breaks down the KPIs that actually drive SaaS growth, organized by funnel stage.
Why SaaS Content Marketing Is Different
SaaS buying decisions aren't impulse purchases. A marketing manager doesn't stumble on your blog post at 9 AM and sign a $500/month contract by noon. The sales cycle for SaaS products runs 30 to 90 days for SMB deals, longer for enterprise. Multiple stakeholders get involved. Prospects read 3 to 5 pieces of content before they even fill out a form.
This creates three challenges:
Attribution is messy. A reader might discover your blog through organic search, return via email, and finally convert after clicking a retargeting ad. Traditional last-click attribution gives all credit to the ad. Multi-touch attribution is closer to reality, but still imperfect.
Volume alone doesn't matter. 10,000 monthly visitors from "how to start a blog" keywords won't drive trials if your product is project management software. Content marketing for SaaS requires tight alignment between content topics and your ideal customer profile.
The funnel is long. Most content focuses on top-of-funnel awareness. But SaaS buyers need middle and bottom-of-funnel content to move forward. A prospect who read your awareness content six weeks ago needs case studies, comparison pages, and ROI calculators when they're finally ready to evaluate tools.
SaaS content marketing KPIs need to account for all of this. You need metrics that track the entire journey, not just the first click or the last conversion.
The SaaS Content Funnel
Before diving into specific KPIs, understand how the SaaS content funnel maps to buyer intent:
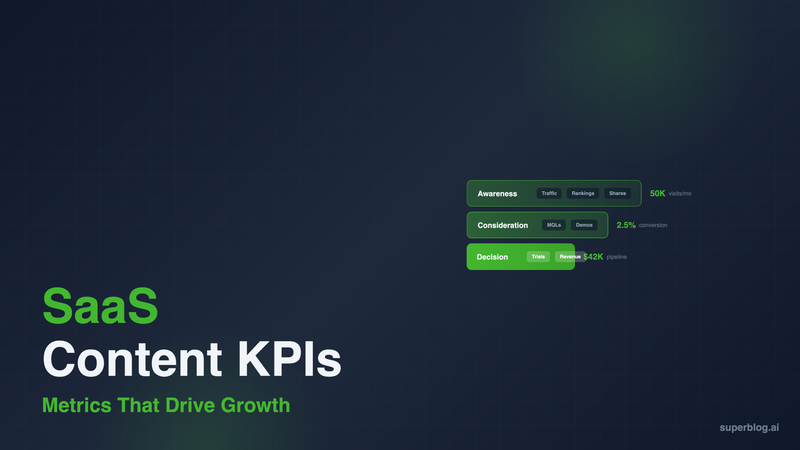
Awareness (Top of Funnel): Prospects have a problem but might not know solutions exist. They're searching for educational content: "how to improve team productivity" or "best practices for remote work." Content types: blog posts, guides, industry reports.
Consideration (Middle of Funnel): Prospects know solutions exist and are researching options. They search for comparisons, alternatives, and specific features: "project management tools for remote teams" or "Asana vs Monday." Content types: comparison pages, webinars, whitepapers, case studies.
Decision (Bottom of Funnel): Prospects are evaluating 2 to 3 vendors and need proof your product works. They search for reviews, pricing details, implementation guides. Content types: product demos, customer stories, ROI calculators, free trials.
Each stage has different KPIs. Awareness content should drive traffic and engagement. Consideration content should generate leads. Decision content should convert to trials and demos.
Awareness Stage KPIs
Organic Traffic Growth
Track month-over-month growth in organic sessions. This measures whether your SEO strategy is working. 10% to 20% monthly growth is typical for blogs under 12 months old. Growth slows as you gain more authority.
Look at organic traffic by landing page. Which posts drive the most traffic? Are they aligned with your ICP? If your top post is "free project management tools" but you sell premium software, that traffic won't convert.
Keyword Rankings
Track rankings for target keywords, especially those with commercial intent. A post ranking #15 for "team collaboration software" is worth more than a #3 ranking for "what is teamwork." Commercial keywords signal buying intent.
Don't just track rankings. Track ranking improvements over time. A post that moves from page 3 to page 1 in 60 days proves your content and SEO strategy is working.
Time on Page and Pages per Session
These metrics measure engagement. A 4-minute average time on page suggests readers find your content valuable. Under 30 seconds usually means the content didn't match search intent.
Pages per session tells you if readers explore beyond the landing page. 2+ pages per session suggests your internal linking and related content strategy is working.
Scroll Depth
Track how far readers scroll on long-form content. If 70% of readers bounce before reaching the first H2, your intro isn't hooking them. If drop-off happens at 50%, that section might be the problem.
Use scroll depth to identify which sections readers skip. Rewrite or remove sections that consistently lose readers.
Brand Search Volume
Track branded search queries (your company name, product name) in Google Search Console. Growing brand search volume means your content is building awareness. Prospects who discover you through content often return via branded search later.
Compare branded search volume to non-branded organic traffic. A healthy ratio is 20% to 40% branded searches. Too low means awareness isn't converting to consideration. Too high might mean you're relying too much on existing brand awareness.
Consideration Stage KPIs
This is where content marketing starts driving business outcomes. Prospects move from anonymous readers to identifiable leads.
Lead Generation Rate
Calculate leads per 1,000 pageviews. The formula: (Total leads / Total pageviews) x 1,000.
Typical SaaS lead gen rates range from 0.5% to 3%, depending on offer type and audience fit. Bottom-of-funnel content (comparison pages, pricing pages) converts at 5% to 10% or higher. Top-of-funnel educational content converts at 0.3% to 1%.
Track lead gen rate by content type. If comparison pages convert at 8% but how-to guides convert at 0.2%, double down on comparison content.
Marketing Qualified Leads (MQLs)
Not all leads are equal. A reader who downloads a generic industry report might never buy. A reader who requests a demo or starts a free trial has real intent.
Define what qualifies as an MQL for your business. Common criteria:
Works at a company in your target industry
Has a relevant job title (marketing manager, product lead, founder)
Visited pricing or product pages
Engaged with multiple pieces of content
Fits your ideal customer profile by company size or budget
Track the percentage of content-generated leads that become MQLs. A high lead count with low MQL rate means your content is attracting the wrong audience.
Email Subscribers
Email subscribers represent owned audience. They've given permission for ongoing communication. Track subscriber growth rate and subscriber-to-MQL conversion rate.
Look at which content pieces drive the most email signups. High-performing posts are candidates for content upgrades (bonus templates, checklists, or tools offered in exchange for email).
Content Download Rate
If you gate content (whitepapers, templates, calculators), track download rate: (Downloads / Landing page visitors) x 100.
Typical download rates for gated content range from 5% to 30%. Lower rates suggest either weak content offers or poor landing page copy. Test different offers and page designs to improve conversion.
Demo Requests
Demo requests are high-intent actions. Track which content pieces drive the most demo requests. These are your revenue-generating assets.
Calculate demo request rate by landing page. If a comparison post drives 10 demo requests per 1,000 visitors, that's a 1% demo rate. That content is directly contributing to pipeline.
Return Visitor Rate
Track the percentage of visitors who return to your site multiple times. SaaS buying cycles are long. Prospects rarely convert on first visit.
A healthy return visitor rate is 20% to 40%. Lower rates might indicate weak calls to action, poor email nurturing, or content that doesn't leave readers wanting more.
Use Google Analytics cohorts or similar tools to see how return visitors behave differently. Do they visit more pages? Convert at higher rates? Spend more time on site?
Decision Stage KPIs
Decision-stage content directly impacts revenue. These KPIs measure how effectively content moves prospects from evaluation to purchase.
Free Trial Signups
Track free trial signups attributed to content touchpoints. Use UTM parameters and CRM integration to see which posts influenced trial decisions.
Calculate trial signup rate: (Trial signups / Landing page visitors) x 100. Decision-stage content (pricing pages, product tours, customer stories) should convert at 3% to 10% or higher.
Look at trial signup quality. Do content-generated trials convert to paid customers at the same rate as other channels? Higher conversion rates prove content is attracting the right prospects.
Product Qualified Leads (PQLs)
PQLs are trial users who hit activation milestones that predict conversion. Examples:
Invited team members
Completed onboarding
Created their first project or campaign
Used the product 3+ days in first week
Track what percentage of content-attributed trials become PQLs. Low PQL rates suggest content is attracting tire-kickers, not serious buyers.
Content-Influenced Pipeline
Track deals where prospects engaged with content during the sales cycle. Use your CRM to see which content pieces appear in closed-won deals.
This doesn't require perfect attribution. If 60% of closed deals involved prospects who read 2+ blog posts or downloaded a case study, content played a role in those deals.
Calculate content-influenced revenue: Sum of deal values where content was a touchpoint. Compare this to your content marketing budget to estimate ROI.
Average Contract Value (ACV) of Content Leads
Track whether content-generated leads close at higher or lower ACV than other channels. Some content attracts enterprise buyers, other content attracts SMBs.
If your target customers are mid-market but your content attracts freelancers and solopreneurs, your messaging needs adjustment. Align content topics, case studies, and positioning to your revenue targets.
Sales Cycle Length
Do content-influenced deals close faster or slower than average? Content-educated prospects often move faster because they arrive at the sales conversation already informed.
Track days from first content touchpoint to closed deal. If content-influenced deals close 20% faster, that's an argument for investing more in content marketing.
Customer Acquisition Cost (CAC)
Calculate CAC for content-generated customers: (Total content marketing spend / Number of customers acquired through content).
Compare content marketing CAC to paid acquisition CAC. In mature SaaS companies, content-driven CAC is often 30% to 50% lower than paid channels. Early-stage companies might see higher content CAC initially, but it improves as content compounds.
SaaS Content Marketing Benchmarks
Benchmarks vary widely by industry, deal size, and product complexity. Use these as directional guides, not absolute targets.
These benchmarks assume content targeting the right audience. Off-target content can hit 100,000 monthly visits and generate zero qualified leads.
Building Your KPI Dashboard
Track too many KPIs and you'll drown in data. Track too few and you'll miss problems until it's too late. Here's how to build a content marketing KPI dashboard that actually gets used:
Essential KPIs (Track Weekly)
Organic traffic (total and by top landing pages)
Lead generation rate
MQLs from content
Demo requests or trial signups attributed to content
Top-performing content pieces
Important KPIs (Track Monthly)
Keyword ranking changes for target terms
Email subscriber growth
Return visitor rate
Content-influenced pipeline (deals in progress)
Traffic-to-MQL conversion rate
Pages per session and time on page
Strategic KPIs (Track Quarterly)
Customer acquisition cost (content channel)
Content-influenced closed revenue
Average contract value by content type
Sales cycle length for content-influenced deals
Brand search volume trends
Tools for Tracking
You don't need a massive tech stack to track content KPIs. Start simple:
Google Analytics 4: Track traffic, engagement, conversions, and user behavior. Set up goals for key actions (form fills, trial signups, demo requests). Use UTM parameters to identify traffic sources.
Google Search Console: Monitor keyword rankings, impressions, and click-through rates. Identify which posts are gaining or losing visibility.
CRM integration: Connect your CRM (HubSpot, Salesforce, Pipedrive) to your analytics. Track which content pieces influence deals. See how content-generated leads convert compared to other channels.
Lead attribution tools: Use tools like HubSpot, Marketo, or Segment to track multi-touch attribution. Understand the full customer journey, not just the last click.
Superblog's built-in analytics: If you're running your blog on Superblog, the Pro and Super plans include privacy-friendly analytics powered by Pirsch. Track pageviews, unique visitors, referrers, and top content without cookies or consent banners. Unlike Google Analytics, Pirsch is GDPR-compliant by default, which matters for global audiences.
Lead forms and tracking: Superblog's built-in lead generation forms capture email addresses directly on your blog posts. No third-party tools, no complicated integrations. Forms appear below posts, in the sidebar, or as pop-ups. Super plan users get webhook integration, so new leads automatically flow into your CRM, email tools, or Zapier workflows. This direct connection between content and lead capture makes it easier to track content-to-pipeline attribution.
Set up a simple spreadsheet or dashboard to centralize your KPIs. Update it weekly. Review trends, spot anomalies, and adjust strategy based on what's working.
Common KPI Mistakes
Tracking Vanity Metrics
Pageviews and social shares feel good but don't predict revenue. A post with 50,000 views and zero conversions failed. A post with 500 views and 10 demo requests succeeded.
Focus on metrics tied to business outcomes. Traffic matters only if it's the right traffic converting at acceptable rates.
Ignoring Content Quality in Favor of Volume
Publishing 20 mediocre posts per month won't outperform 5 excellent posts. Quality content ranks better, drives more engagement, and converts at higher rates.
Track quality signals: time on page, scroll depth, return visits, backlinks, keyword rankings. High-quality content performs across all these dimensions.
Not Segmenting Metrics by Funnel Stage
Judging top-of-funnel content by trial conversion rate is unfair. Awareness content should drive traffic and engagement, not trials. Evaluate each content type by appropriate KPIs.
Build separate dashboards or reports for awareness, consideration, and decision content. Track funnel progression: Does awareness content drive consideration touchpoints? Does consideration content lead to decision actions?
Giving Up Too Soon
Content marketing compounds slowly. New blogs take 6 to 12 months to gain traction. Individual posts take 3 to 6 months to rank.
Track leading indicators (keyword rankings, impressions, engagement) while you wait for lagging indicators (traffic, leads, revenue) to materialize. A post ranking #8 after 2 months will likely hit page 1 given more time.
Not Connecting Content to Revenue
If you can't connect content marketing to revenue, you can't defend the budget. Use CRM data to show content's role in closed deals.
Build a simple attribution model. Tag content touchpoints in your CRM. Pull quarterly reports showing content-influenced pipeline and revenue. Present this data to stakeholders.
Putting It All Together
Content marketing for SaaS isn't about traffic. It's about attracting the right prospects, educating them, building trust, and guiding them toward a purchase decision. The KPIs that matter most depend on where prospects are in the journey.
Track awareness metrics (traffic, rankings, engagement) to ensure you're building an audience. Track consideration metrics (leads, MQLs, demo requests) to prove content generates pipeline. Track decision metrics (trials, PQLs, closed revenue) to demonstrate ROI.
Start simple. Pick 5 to 7 KPIs that map to your current goals. Build a dashboard you'll actually review weekly. Adjust strategy based on what the data tells you.
Content marketing takes time, but the right KPIs help you measure progress, prove value, and scale what works.
Ready to start tracking content performance? Superblog's built-in analytics and lead generation tools make it easy to connect content to pipeline. Privacy-friendly analytics, lead capture forms, and CRM integrations work out of the box. No configuration, no plugins, no developer required. Start your 7-day free trial at superblog.ai and see which content drives results.