Blog Performance & Core Web Vitals: Why Speed Equals Rankings
Google ranks fast pages higher. This isn't speculation, it's documented: Core Web Vitals are official ranking factors.
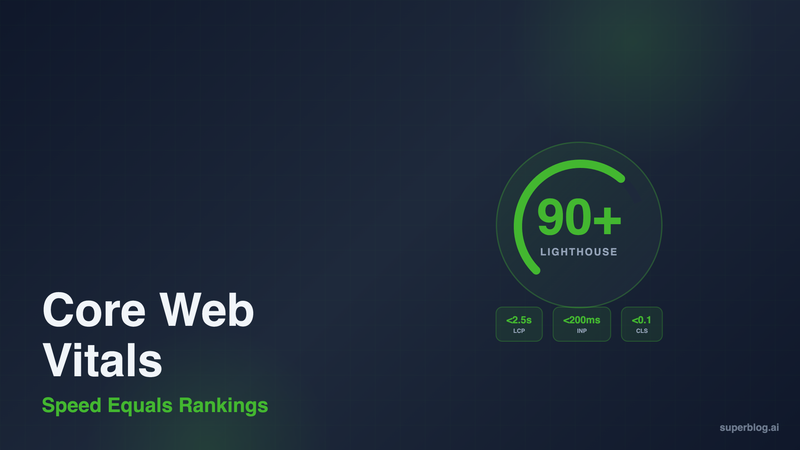
Your blog's speed directly impacts where you appear in search results. A slow page means fewer visitors, less engagement, and lost revenue. A fast page means better rankings, more traffic, and higher conversions. The difference between a 40 Lighthouse score and a 90+ score is the difference between page 3 and page 1.
This guide covers what Core Web Vitals are, why they matter for rankings, how to measure them, and how to fix the performance issues that hurt your blog.
What Are Core Web Vitals?
Core Web Vitals are three metrics Google uses to measure page experience. They track how fast your content loads, how quickly users can interact, and how stable the page is while loading.
The three metrics:
Largest Contentful Paint (LCP): Measures loading speed. LCP tracks when the largest content element (usually a hero image, video, or text block) becomes visible. Target: under 2.5 seconds. Slow LCP = users see a blank page or loading spinners. Fast LCP = content appears instantly.
Interaction to Next Paint (INP): Measures responsiveness. INP tracks the time from when a user clicks or taps until the page responds. Target: under 200 milliseconds. Slow INP = buttons feel unresponsive, menus lag. Fast INP = immediate feedback to every interaction. (INP replaced First Input Delay in 2024 to capture more interaction scenarios.)
Cumulative Layout Shift (CLS): Measures visual stability. CLS tracks unexpected layout shifts during page load. Target: under 0.1. High CLS = text jumps around, users accidentally click the wrong button. Low CLS = content stays where it appears.
These aren't abstract performance metrics. They're user experience signals tied directly to how people interact with your blog.
Why Core Web Vitals Affect Rankings
Google announced Core Web Vitals as a ranking factor in 2021. Fast pages get a ranking boost. Slow pages get penalized.
The reason is behavioral. Fast pages keep readers engaged. Slow pages drive them away. Google tracks bounce rate, time on page, and pages per session. When your blog loads in under 1 second, readers stay. When it takes 5 seconds, they hit the back button and click a competitor.
The performance-rankings correlation:
A 1-second delay in page load time reduces conversions by 7% (Akamai research). Mobile users are even less patient: 53% abandon sites that take over 3 seconds to load (Google data). Google knows this. If two pages have similar content quality, the faster page wins.
Core Web Vitals also tie into Google's broader Page Experience signals (mobile-friendliness, HTTPS, no intrusive interstitials). But Core Web Vitals are the only Page Experience factors tied to measurable speed.
Lighthouse scores vs. Core Web Vitals:
Lighthouse is a Google tool that measures performance in a lab environment. Core Web Vitals measure real user performance (called "field data"). Both matter. Lighthouse scores predict how real users will experience your blog. If your Lighthouse score is below 90, your field data is likely failing too.
Target: 90+ on mobile, 95+ on desktop. Anything below 50 is a ranking liability.
How to Measure Core Web Vitals
You need two measurement approaches: lab data (controlled testing) and field data (real users).
Lab Data: Lighthouse and PageSpeed Insights
Lighthouse runs in Chrome DevTools. Open your blog in Chrome, press F12, click "Lighthouse," and run an audit. You'll get scores for Performance, Accessibility, Best Practices, and SEO. Focus on Performance.
Lighthouse shows:
- Overall performance score (0-100)
- LCP, INP, and CLS values
- Opportunities (specific fixes ranked by impact)
- Diagnostics (what's slowing the page down)
Run Lighthouse in Incognito mode to avoid interference from browser extensions.
PageSpeed Insights (https://pagespeed.web.dev) combines Lighthouse scores with field data from real users. Enter your URL and get both lab and field results. If field data is available, it's based on the Chrome User Experience Report (CrUX), which aggregates data from Chrome users who opted in to usage stats.
Field Data: Search Console and CrUX
Google Search Console (Performance > Core Web Vitals) shows which URLs are passing or failing based on real user data. Google groups URLs by status: Good, Needs Improvement, or Poor.
Check this monthly. If you see URLs moving from Good to Needs Improvement, investigate immediately.
Chrome User Experience Report (CrUX) provides 28-day rolling averages of Core Web Vitals for your entire site. Access it via PageSpeed Insights or the CrUX API. CrUX data takes 28 days to update, so don't expect instant results after fixing performance issues.
What to Track
Run Lighthouse weekly on your 5-10 most important pages. Track:
- Performance score trend (is it improving or degrading?)
- LCP values (aim for under 1.5s)
- CLS values (aim for under 0.05)
- Total Blocking Time (aim for under 200ms)
Monitor Search Console Core Web Vitals monthly. If you see a sudden spike in Poor URLs, something broke (a new plugin, theme update, or third-party script).
Common Blog Performance Issues
Most blogs fail Core Web Vitals for predictable reasons. These are the top culprits.
Large, Unoptimized Images
Images are the #1 cause of slow LCP. A 2MB JPEG hero image destroys performance. Readers on mobile networks wait 5+ seconds for it to load.
Fixes:
- Use WebP format (30-50% smaller than JPEG at the same quality)
- Compress images before uploading (tools: TinyPNG, Squoosh)
- Serve responsive images (different sizes for mobile vs. desktop)
- Lazy-load images below the fold
Your above-the-fold hero image should be under 100KB. Everything else can lazy-load.
Render-Blocking JavaScript and CSS
Scripts and stylesheets in the <head> block page rendering. The browser downloads and executes them before showing any content.
Fixes:
- Inline critical CSS (styles needed for above-the-fold content)
- Defer non-critical JavaScript (use
deferorasyncattributes) - Remove unused CSS and JS (many themes load 200KB+ of code you never use)
- Minify and bundle assets
If you're using WordPress with a page builder (Elementor, Divi), this is especially bad. Page builders inject massive CSS and JS payloads.
Third-Party Scripts (Analytics, Ads, Social Widgets)
Every third-party script adds latency. Google Analytics, Facebook Pixel, ad networks, chatbots: they all slow your page.
Fixes:
- Use privacy-friendly analytics that load faster (Pirsch, Plausible)
- Load third-party scripts asynchronously (
asyncordefer) - Avoid social share widgets that load remote JavaScript (use static SVG icons instead)
- Limit ad networks to one or two (every ad network = more blocking scripts)
If a script doesn't directly generate revenue or critical data, remove it.
Hosting and Server Response Time
Shared hosting is slow. If your Time to First Byte (TTFB) is over 600ms, your server is the bottleneck.
Fixes:
- Use a CDN (Cloudflare, Fastly)
- Upgrade to better hosting (move off $5/month shared hosting)
- Enable server-side caching
- Use static site generation instead of server-rendered pages
JAMStack blogs (pre-built static pages served from a CDN) have near-instant TTFB because there's no server processing on each request.
Layout Shifts from Ads and Embeds
Ads and embeds (YouTube videos, Twitter tweets) load after the page and push content down. This creates high CLS.
Fixes:
- Reserve space for ads with CSS (set fixed width/height)
- Use placeholder containers for embeds
- Set explicit width and height attributes on images and iframes
- Avoid inserting content above existing content after page load
If you can't control ad sizes (programmatic ads), use sticky ad containers with fixed dimensions.
How to Fix Core Web Vitals Issues
Once you've measured your blog and identified issues, here's how to fix them.
Optimize Images
Convert all images to WebP. Compress them to under 100KB for hero images, under 50KB for inline images. Use responsive image syntax:
<img src="image.webp"
     srcset="image-480.webp 480w, image-800.webp 800w, image-1200.webp 1200w"
     sizes="(max-width: 600px) 480px, 800px"
     alt="Description">
This tells browsers to load the appropriate size based on screen width.
For WordPress, use plugins like ShortPixel or Imagify. For custom setups, use a CDN with automatic image optimization (Cloudflare, Cloudinary).
Defer Non-Critical JavaScript
Move all non-essential scripts to the footer or add defer:
<script src="analytics.js" defer></script>
Inline critical JavaScript directly in the HTML for instant execution. Reserve defer for scripts that don't affect above-the-fold rendering.
Use a CDN
A CDN caches your blog's static assets (HTML, CSS, JS, images) across 200+ global edge locations. Readers in Tokyo get your blog from a Tokyo server. Readers in London get it from London.
CDNs also enable automatic compression (Brotli, Gzip) and HTTP/2, both of which speed up delivery.
Most CDNs also offer automatic WebP conversion, so you don't need to manually optimize images.
Switch to JAMStack Architecture
JAMStack (JavaScript, APIs, Markup) pre-builds your entire blog as static HTML at deploy time. There's no server-side rendering, no database queries, no PHP execution on each request.
Benefits:
- Near-instant TTFB (under 100ms)
- No server crashes under traffic spikes
- 90+ Lighthouse scores by default
- Minimal attack surface (no server-side code to exploit)
Popular JAMStack generators: Next.js (Static Export), Gatsby, Hugo, 11ty.
Superblog uses JAMStack architecture. Every page is pre-built and served from a global CDN. This is why Superblog customers get 90+ Lighthouse scores automatically, without any configuration.
Remove Unused Code
Audit your blog for unused CSS and JavaScript. Tools like Coverage in Chrome DevTools show which code executes on page load.
If you're loading 200KB of CSS but only using 30KB, strip the rest. This alone can shave 1-2 seconds off LCP.
For WordPress, use plugins like Asset CleanUp or Perfmatters to disable unnecessary scripts per page.
How Superblog Solves Core Web Vitals
Most blog platforms require manual optimization. You install plugins, configure caching, compress images, defer scripts, and hope you don't break anything. Then a plugin updates and your Lighthouse score tanks.
Superblog takes a different approach: performance is built into the architecture.
JAMStack by default: Every blog on Superblog is pre-built as static HTML. Pages load from a global CDN with 200+ edge locations. No server processing, no database queries. This means instant TTFB and fast LCP automatically.
Automatic image optimization: Upload any image format (JPEG, PNG, GIF) and Superblog converts it to WebP. Images are compressed, served responsively, and lazy-loaded. You don't configure anything. It just works.
Auto-generated schemas and clean HTML: Superblog outputs minimal, semantic HTML with JSON-LD schemas for SEO. No bloated page builders, no unused CSS. Every kilobyte is intentional.
90+ Lighthouse scores out of the box: Customers routinely see 90-95 on mobile, 95-100 on desktop. No plugins, no caching configuration, no optimization work.
This is what "zero maintenance" means. You focus on writing. Superblog handles the technical SEO and performance automatically.
If you're migrating from WordPress, the performance improvement is immediate. WordPress blogs with 25+ plugins typically score 40-60 on Lighthouse. After migrating to Superblog, the same content scores 90+. Same posts, same images, but served from a platform built for speed.
The result: better rankings, lower bounce rates, higher conversions. Speed is a competitive advantage.
Benchmarks: What Scores Should You Target?
Google's guidance is "Good" Core Web Vitals (green in Search Console). But that's the baseline. To actually compete, aim higher.
Lighthouse Performance Score:
- 90-100: Excellent (target this)
- 50-89: Needs improvement
- 0-49: Poor (ranking liability)
LCP (Largest Contentful Paint):
- Under 1.5s: Excellent
- 1.5s-2.5s: Good
- Over 2.5s: Poor
INP (Interaction to Next Paint):
- Under 200ms: Good
- 200ms-500ms: Needs improvement
- Over 500ms: Poor
CLS (Cumulative Layout Shift):
- Under 0.1: Good
- 0.1-0.25: Needs improvement
- Over 0.25: Poor
If you're consistently hitting 90+ on Lighthouse and all Core Web Vitals are "Good" in Search Console, you're outperforming 80% of blogs.
Core Web Vitals and Mobile Performance
Mobile performance is harder than desktop. Mobile devices have slower processors, smaller bandwidth, and higher latency.
Google uses mobile-first indexing. Your mobile performance is your ranking signal. If your mobile Lighthouse score is 45 but desktop is 90, Google sees 45.
Mobile-specific fixes:
- Reduce image sizes even further (50KB max for hero images)
- Minimize JavaScript execution (mobile CPUs are slower)
- Avoid large CSS frameworks (Bootstrap, Tailwind's full build)
- Test on real devices, not just Chrome DevTools simulation
Superblog's mobile Lighthouse scores average 90-92 because of aggressive image optimization and minimal JavaScript. The same content that loads in 3 seconds on WordPress loads in under 1 second on Superblog.
What to Do Next
Start by measuring your current performance. Run Lighthouse on your 5 most important pages. Note your LCP, INP, and CLS values.
Identify the biggest bottleneck:
- LCP over 3s? Fix images.
- INP over 500ms? Defer JavaScript.
- CLS over 0.2? Reserve space for ads and embeds.
Make one change, re-measure, repeat. Small improvements compound.
If you're on WordPress with 20+ plugins and a page builder, you're fighting the platform. WordPress wasn't built for 90+ Lighthouse scores. Superblog was.
Migrate to Superblog if you want performance without the optimization work. Import your content in 10 minutes, publish, and let the platform handle the rest.
Your blog's speed is a ranking factor. Fast pages win.