
How we cut our Next.js deploys from 14.5 minutes to 5

Superblog is a JAMstack blogging platform built with a focus on speed and SEO. Customers write in our dashboard, and we build their blogs into static sites. The dashboard is the part this post is about.
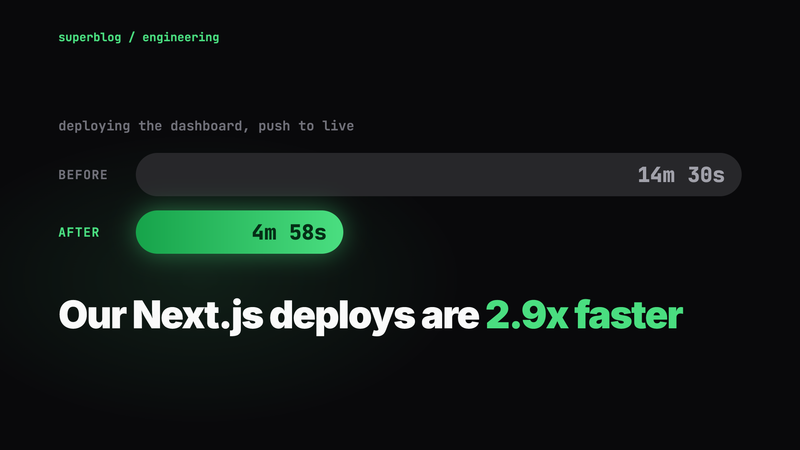
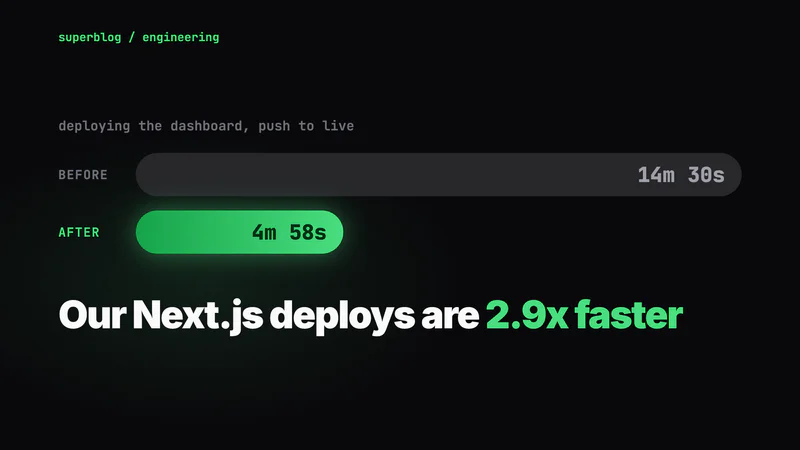
Every push to master deploys the dashboard. The median deploy over our last 28 runs took 14.5 minutes (Max 25 minutes). A deploy now takes about 5 minutes; the latest one took 4 minutes 58 seconds.
None of this needed new infrastructure. Most of it was measuring where the time went and finding that several things we believed about our pipeline were not true.
The app
The dashboard is a Next.js 16 app on the Pages Router. Some numbers, so you can compare it with your own:
171,286 lines of TypeScript in 1,053 files, not counting tests.
2,821 unit tests in 133 files. They run in about 15 seconds.
44 pages, 41 API routes and about 250 oRPC procedures.
189 dependencies, which install as 947 packages and 1.6 GB of
node_modules.8,000+ commits.
It runs as one ECS task on AWS Fargate (ARM), with a cloudflared sidecar that connects it to Cloudflare through a tunnel. CI runs on GitHub Actions with Ubicloud runners.
How a deploy worked
A type check and the unit tests run in one job.
In parallel, a Docker build runs
npm ciandnext build, then pushes an ARM image.A check starts the image and loads every package in it, so a native binary built for the wrong platform fails here instead of in a customer's request.
A job applies Prisma migrations to production.
A job registers a new ECS task definition, updates the service, and waits for the rollout to finish.
Each step is there for a reason, and we kept all of them. We only changed how long each one takes.
Step zero: measure every step
We pulled the step timings for recent runs from the GitHub API, and the rollout events from ECS. One clean run, with no queueing, took 13.9 minutes:
Two lines stood out. Nobody needed the last 2.5 minutes. And the build spent more time collecting traces than compiling.
1. Stop waiting for the old task to stop (saved 2.5 minutes)
The deploy job waited for ECS to report the rollout as COMPLETED. ECS only reports that after the old task has stopped, and the new task was serving traffic about 2.5 minutes before that.
Only one thing needs the old task gone: a destructive migration, such as dropping a column, which we apply after the rollout so no old code is left to read it. So the job now finishes as soon as the new task is running and the public health check returns 200. It still waits for COMPLETED when a destructive migration is pending.
2. The npm ci cache that never worked (saved about 100 seconds)
The workflow used the GitHub Actions cache for Docker layers with cache-to: type=gha,mode=min. A comment above it explained that min keeps the npm ci layer, because that layer only changes when package-lock.json changes.
That comment was wrong. mode=min only exports the layers of the final stage of a multi-stage build. Our npm ci ran in a deps stage, so it was never cached. Every deploy installed 947 packages from scratch, then copied node_modules into the next stage.
mode=max would cache it, but we had tried that before. It spent about a minute per build uploading layers that change on every commit.
We moved the build out of Docker instead. The runner restores node_modules and .next/cache from the Actions cache, runs next build, and the Dockerfile only copies in the standalone output. The restore takes about 10 seconds.
This meant moving the runtime image from Alpine to Debian slim. Native binaries installed on the Ubuntu runner are linked against glibc, and Alpine uses musl. The image grew from 155 MB to 173 MB.
We broke a deploy doing this
The first deploy with the new image never took traffic. The new task started, and its health check failed until the job timed out.
The old Dockerfile started the server with the shell form CMD HOSTNAME=0.0.0.0 node server.js. We changed it to the exec form CMD ["node", "server.js"] and set HOSTNAME with ENV instead. Fargate sets HOSTNAME to the task's own hostname, which overrides the image's ENV. Next.js then listened on that address only, and the health check calls localhost.
It worked in local Docker, because local Docker does not override HOSTNAME that way. Production stayed on the previous task the whole time, because ECS never moved traffic to a task that failed its health check. The fix was to set the variable on the command line again, with exec so Node stays process 1 and receives SIGTERM.
3. Build traces: 2 minutes of parsing JavaScript
With output set to standalone, next build traces every file the server needs, so the output can run without the full node_modules. On our ARM runner, "Collecting build traces" took 115 to 133 seconds. Compiling took 43.
A CPU profile of a local build showed where the time went. Almost all of it was in @vercel/nft, the tracer: walking syntax trees, parsing with acorn, and about 27 seconds of readlink calls, most of which failed. It parsed 13,295 files.
The count was high because the Pages Router leaves every dependency external by default. The tracer follows each one into node_modules, file by file.
We tried bundlePagesRouterDependencies: true. It bundles dependencies into the server chunks, and the tracer then followed 5,880 files. Locally, tracing dropped from 45 seconds to 25, and the whole build from 96 to 54. A few packages needed to stay external: a native binding, a CommonJS package that required an ESM-only one, and an old SDK that resolves its own modules by name at runtime.
We reverted it before it shipped. It changes how every server dependency loads in production. Our smoke tests passed, but we could not test every logged-in flow, and the gain was about a minute. That was not worth the risk to a system that works.
4. Turbopack (the build went from 2m22s to 16s)
Next.js 16 builds with Turbopack by default. We had pinned webpack with --webpack because the config had a custom webpack() function. A Turbopack build stopped on three errors, and none of them were about that function. They had two causes:
An old email SDK used an AMD
define()form that Turbopack cannot parse. It belonged to a provider we had already moved away from, so we deleted the integration.Two WebAssembly code formatters in our editor, for Go and shell, export names with dots in them, such as
syscall.seek. Turbopack generated invalid JavaScript for both. We switched all seven of these formatters from theirbundlerentry, which imports the.wasmas a module, to theirwebentry, which fetches it on demand. Two other formatters already worked that way.
With those fixed, a clean local build took 16 seconds instead of 96. We also removed @next/bundle-analyzer, because it injects a webpack config, and Next refuses a Turbopack build when one is present.
The bug that only Turbopack found
Testing the branch, the custom domain page crashed with TypeError: (void 0) is not a function.
Our tsconfig.json had a paths entry that pointed the psl package at its own type declaration file. It existed because psl's exports map does not point TypeScript at its types. Webpack ignored the alias at runtime. Turbopack applies tsconfig paths to real imports, so import { parse } from 'psl' loaded a .d.ts file with no code in it.
Three server routes imported psl the same way, so this would have broken in production too. We removed the alias and declared the types in a local .d.ts instead.
If you are moving to Turbopack, check every paths entry in your tsconfig that points into node_modules.
5. Smaller changes that added up
Health check timing. The container health check ran every 15 seconds with 3 retries. Our server is ready about 2 seconds after it starts, and the first check only runs one interval later. We changed it to every 5 seconds with 9 retries. A task is still marked unhealthy only after about 45 seconds of failures, so a slow but live task is not killed any sooner. The next rollout was about 55 seconds faster.
Polling. The deploy job polled ECS every 10 seconds. It now polls every 5.
A flaky package check. The check that loads every package in the image spawns a child process per package. It resolved each child on the exit event, and exit can fire before the child's output has been read. With more parallelism, it reported 12 to 20 harmless packages as failures per run. Waiting for close fixed it, and running the children from a queue instead of fixed batches made the check about 15% faster.
One fewer job. Migrations ran in their own job, on their own runner, which spent 35 seconds on setup for a 2 second migration. They now run as the first steps of the deploy job, before the AWS credentials are loaded, so the database URL and the AWS keys are never in the same steps. That saved about 30 seconds.
What we did not do
Lazy image loading (SOCI). The image pull takes 7.5 seconds, so it could save at most that, and building the index would add more time than that to every build.
Bigger runners. The slow part, tracing, was mostly a single core. Turbopack solved it instead.
Bundling server dependencies. Covered above.
Where the 5 minutes go now
The biggest remaining piece is ECS. About 48 seconds of it is AWS placing the task, which we do not control. Getting much lower would mean different infrastructure, and 5 minutes is fast enough for us.
What we would tell another team
Measure each step before you change anything. Our two biggest wins were a 2.5 minute wait nobody needed and a cache that had never worked.
Read the comments in your pipeline as claims to verify. Ours described a cache that did not exist.
Test container changes on the platform that runs them. Local Docker and Fargate disagreed about one environment variable.
When a slow step is a black box, profile it. "Collecting build traces" looked like Next.js internals until a profile showed it was parsing 13,000 files.
Revert what you cannot verify. We dropped a change that saved a minute because we could not test it well enough.
If your company needs a blog that loads fast and ranks, without a CMS to maintain, try Superblog.
Your blog, without the maintenance
Fast pages, automatic SEO, no plugins to patch. Runs on yoursite.com/blog.
Sai Krishna is the Founder and CEO of Superblog. Having built multiple products that scaled to tens of millions of users with only SEO and ASO, Sai Krishna is now building a blogging platform to help others grow organically.
superblog
Superblog is a blazing fast blogging platform for beautiful reading and writing experiences. Superblog takes care of SEO audits and site optimizations automatically.